
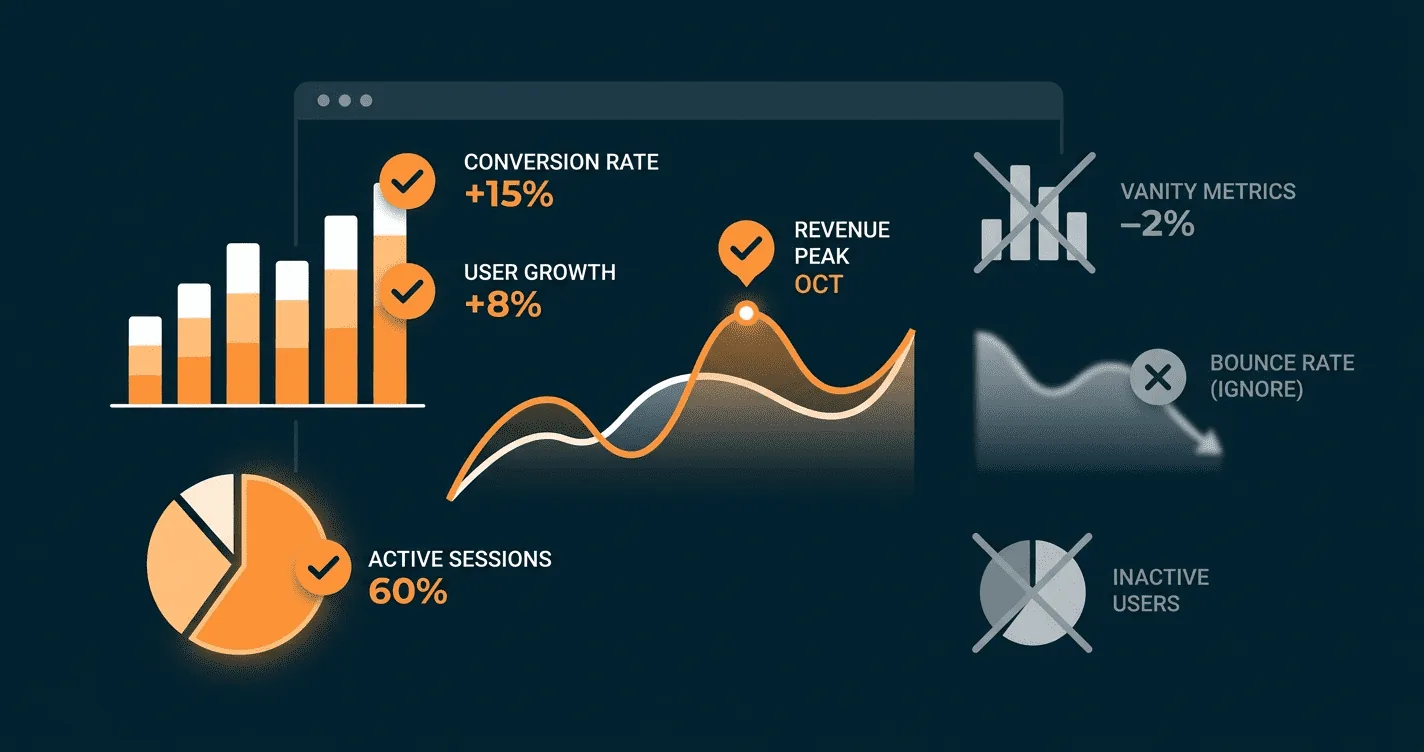
Marketing agencies are very good at producing impressive-looking reports full of numbers that feel like progress.
Impressions: 450,000. Click-through rate: 4.7% (industry average is 3.2%, you’re beating the benchmark!). Website sessions: up 34% month over month. Cost per click: $18.40.
None of these numbers tell an ABA practice whether its marketing investment is producing authorised clients.
After almost a decade of working exclusively with ABA therapy providers, we have a clear view of which metrics actually drive practice decisions and which create a satisfying illusion of insight without the insight.
The Metrics That Actually Matter
Cost per authorised client
This is the number. Total marketing investment (advertising spend, agency fees, automation software) divided by the number of new authorised clients added in the period.
It requires tracking the full intake journey, not just clicks. It requires discipline in CRM entry. It requires patience, because the ABA intake cycle means month-one advertising spend produces authorised clients in months two and three. But once it’s running, it tells the practice exactly what its marketing investment costs per unit of revenue added.
A practice with a cost-per-authorised-client of $800, in a market where each client generates $4,800/month in gross revenue, has very clear ROI. The same practice tracking cost-per-click has no ROI information at all.
Enquiry-to-authorised-client conversion rate
The percentage of all enquiries that eventually become authorised clients. This metric is the intake efficiency measure. It tells the practice whether it’s converting the traffic marketing generates, or losing it in the intake process.
A conversion rate of 25% means one in four enquiries produces an authorised client. A rate of 12% means one in eight. The difference in marketing efficiency between these two rates is significant: a practice at 12% needs twice as many enquiries (and twice the advertising spend) to produce the same number of clients as one at 25%.
First-response time
The time between enquiry submission and first contact from the practice. This is the single most actionable intake metric. It can be improved immediately, it directly correlates with conversion rate, and it requires no changes to advertising.
The target is under five minutes, around the clock. Most practices are significantly above this. The gap between current first-response time and five minutes is a direct measure of enquiry conversion being left on the table.
Days from enquiry to first session
The end-to-end intake cycle time. Shorter is better, not just because revenue starts sooner, but because families that spend less time in the pre-service liminal period are less likely to find alternatives or lose motivation.
This metric also surfaces operational bottlenecks. If the average time from enquiry to assessment is 35 days, that’s a BCBA capacity or scheduling efficiency issue. If the average time from assessment to authorisation submission is 14 days, that may be a treatment planning workflow issue. The metric tells you where the time is being spent.
The Metrics You Can Stop Tracking (or Deprioritise)
Impressions
How many times your ad was shown. Entirely irrelevant to practice growth. An ad that shows 500,000 times and produces two qualified enquiries performed worse than an ad that showed 5,000 times and produced 30.
Click-through rate
How often people click your ad relative to how often it’s shown. Useful as a relative indicator of ad copy quality, but meaningless as a primary metric. A 5% CTR on a poorly-targeted keyword audience is worse than a 2% CTR on a tightly-targeted one.
Cost per click
How much you pay per click. Lower isn’t always better in ABA therapy. The most valuable ABA keywords (the ones that produce the highest qualification rates) are expensive. A campaign optimised for lowest cost-per-click will produce cheap clicks from low-intent audiences. Optimise for cost-per-authorised-client.
Website sessions (in isolation)
Traffic growth isn’t a business outcome. 40,000 website sessions that produce 20 qualified enquiries is worse than 5,000 sessions that produce 50. Track website sessions as a leading indicator only, and always in context of the enquiries and conversions it generates.
Social media followers
Unless a practice is running a deliberate community-building strategy with specific conversion goals, follower count is a vanity metric. It doesn’t correlate with enquiry volume or authorised client acquisition in any meaningful way.
Building the Right Reporting System
The right reporting system for ABA marketing tracks:
- Total marketing investment (by channel)
- Enquiries (by channel, with source attribution)
- Qualified enquiries (after intake call)
- Assessments scheduled and completed
- Authorisations submitted and approved
- New authorised clients (by channel, by cohort)
- Cost per authorised client (by channel)
- First-response time (average)
- Days from enquiry to first session (average)
This system requires connecting advertising data to CRM data, which requires consistent CRM entry and monthly data review. It isn’t the most glamorous part of marketing. It’s the part that tells a practice whether its marketing investment is working.
We provide this reporting as a standard component of every client programme. The monthly report covers all of the above. Not clicks and impressions.
Reputation Elevation tracks marketing performance to the metrics that matter for ABA practice growth. Schedule a strategy call to discuss your current reporting.